Evaluation of training
This is second article that continues the discussion about the RS800CX. Today we will discuss the post workout analysis that you can do in the watch and in the PPT5 software.
As you can see from the previous article the RS800CX captures just an amazing amount of information about the exercise. In the examples here I use few different sessions to show the amount of information you get in the watch and later can review in even more detail in the software. The RS800CX is watch for anyone who likes to dig through data and wants analyze workout details for selected workouts (or all of them if you have enough time). Let's start with few pictures that show the data you can get directly in the watch right after you finish the session.
First picture shows the overview information about the workout. It includes the start time, distance ad duration of the session.

You can drill down through the data and review the min / max and average HR, calories burned, max / avg pace info, cadence (shown below), stride length [the previous two are specific to S3 sensor for the run and cadence sensor for the bike], Running Index, Altitude info, Ascend, Descend, Temperature.

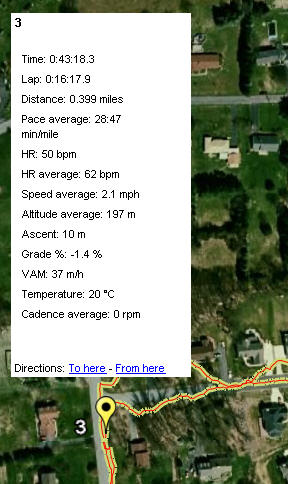
Besides the above listed information you can review the time spent in each HR zone, Time, pace, HR and other information about each phase if you followed pre-planned workout and also review the details about each lap that you recorded during the workout (see the picture below for top screen, you can then drill down to details). The amount of information is more than sufficient.

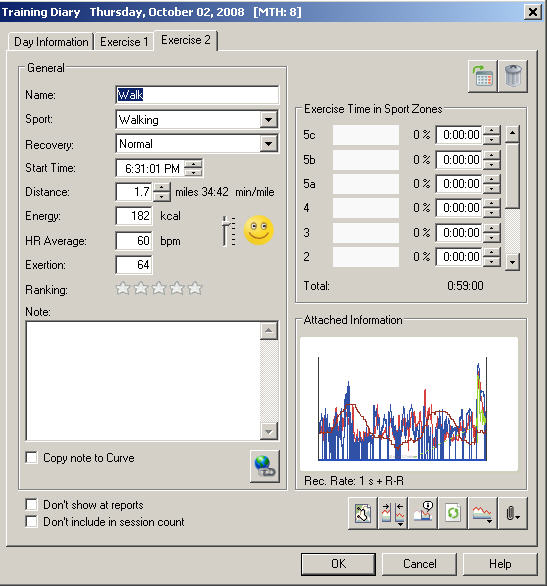
You can then transfer the data from the watch to the Polar Pro Trainer 5 software that comes with the watch and works on Windows (or if you are Mac user you can use it in Parallels, VMware or BootCamp). The analysis in the PPT5 gives you detailed data for each recording interval you selected - e.g. 1s, 2s, 5s, etc. as I listed them in the previous article. The actual workout file provides a great amount of detail from the session as shown below.
You can review each data point of each lap for various information. Additionally you can play around with the selection bar below the graph (the blue thick line) and select only specific parts of the exercise and then review the details of the selected part of the session. As shown in the example below (note that this is a different workout than the one shown on the watch above).
Generally I enable display of maximum of four variables in the graph - e.g. HR, pace, altitude and cadence which is still possible to read. But you can enable as many as all variables captured or just one - the flexibility of PPT5 is hard to beat in this segment of the software from HRM manufacturers. In the analysis you can review the lap information, change the lap type to indicate specific events during the race or training session (like I blew-up here). The colors in the background are showing the HR zones for the session. In PPT5 you can define up to four different HR sport zones and assign them to individual sports. This is extremely useful for triathletes and other multi sport athletes that train at different intensities in different sports. The watch itself supports only one sport zone, but I do not find that limiting as each exercise you define uses the HR zones of the sport you define in the software. E.g. if I define a run in zone 1 and 2 it will have different HR limits than if I define bike in zone 1 and 2 as separate exercises. It is little more complicated when you have to do a brick, then you need to set the HR zones manually in the brick phases to stay within the limits as you intend. This also introduces an issue in analysis of the brick as only one HR sport zone can be associated with one sport. Therefore I think the way Polar handles the multi-sport mode on the watch is good - record each part of the brick as separate exercise you can evaluate separately, but when you exercise you can see the combined time, distance and calories in the multi-sport view. Then in the analysis you can also activate the multi-sport view and review the workouts. Since I did not do any bricks with the watch yet I'll need to do some more research on this and report back in another article.


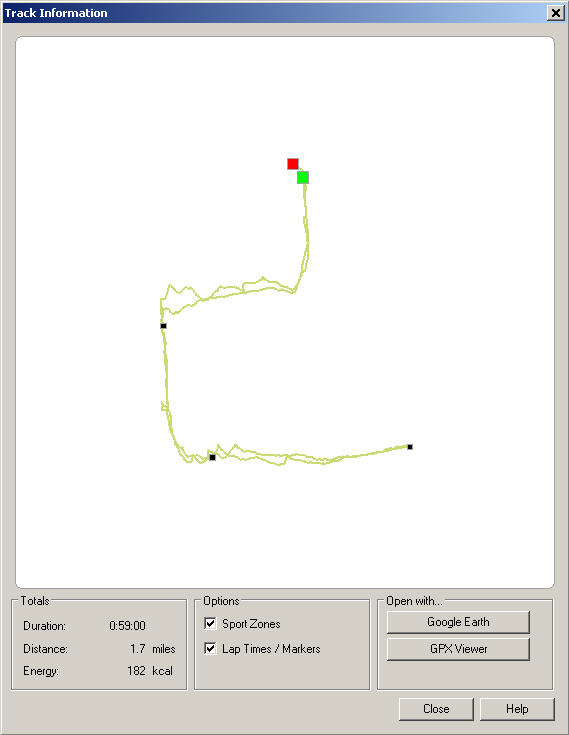
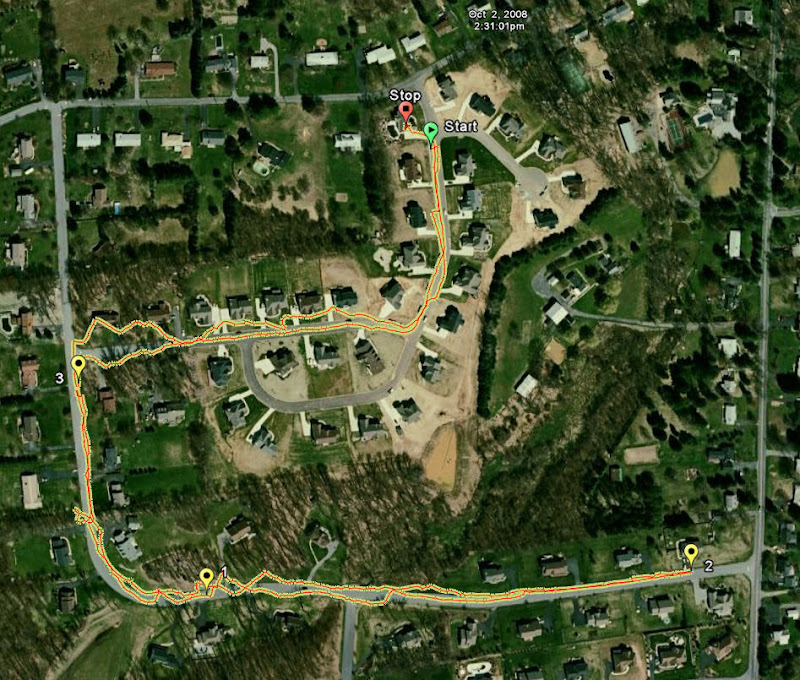
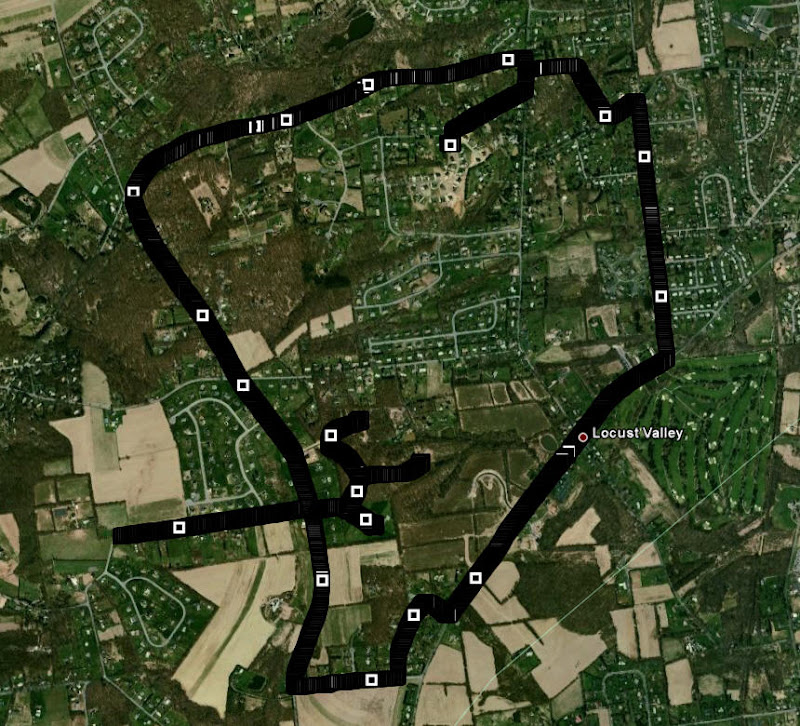
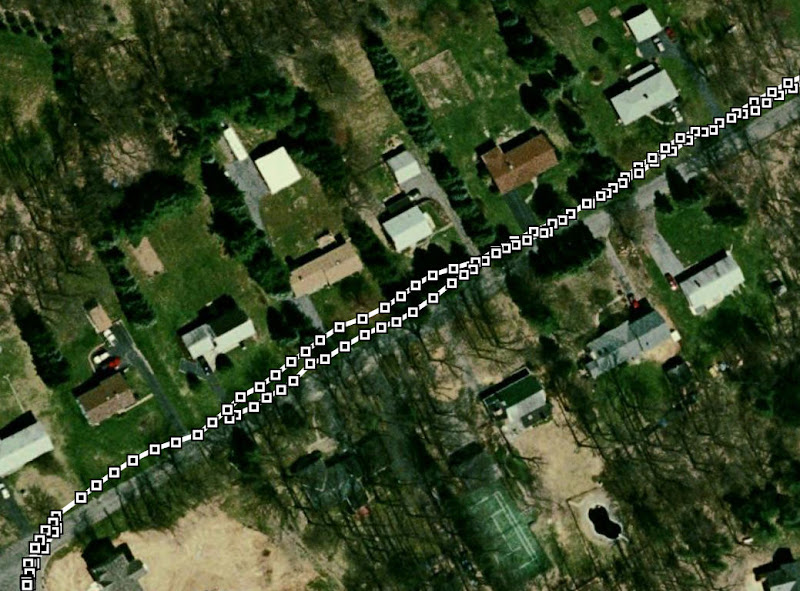
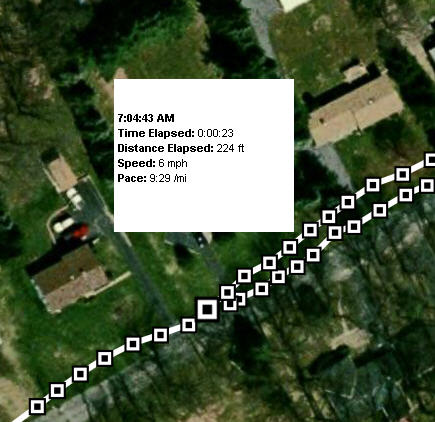
The RS800CX in conjunction with the Polar G3 GPS sensor captures location information for each session that you can later view in the software directly or in the GoogleEarth. The analysis in Google Earth is pretty nice as the path shows graphically not only the location but also color codes the HR zone you were in and shows the phase switches as well as the lap information. It is pretty interesting to review the workout in this way and see where you pushed harder and where you relaxed a bit. At this point you can not load the workouts to a website and share easily with friends (as Garmin Connect allows), but I have no doubt this will eventually become available on the Polar Personal Trainer on-line.

Let's look at another part of PPT5 which is reporting - most products from other HRM providers have pre-defined set of reports with very minimal ability to customize them to fit your needs. Not the PPT5 - the ability to define additional reports than the five enabled by default is great. You can customize the standard reports or define new ones as you need and then look at the data as you are pleased. It is quite impressive how much you can customize the reports and review any combination of data from your log over any period of time. Below are two simple reports showing time in sport zones per week.
The second picture shows the run pace with average HR and distance. You can define anything you want.
In the next article I'll look at the additional third party software I use for analysis in addition to the Polar Pro Trainer 5.


Tests
A unique feature of any Polar HRM is the set of tests that Polar devised in their research and built into the watch. The RS800CX offers two tests - the Fitness Test and Optimizer Test. I run the fitness test twice a week to see how my fitness progresses over time and as part of running it I have RS800CX predict my maximum HR. The Optimizer test is used to determine whether the training is structured optimally and the test result can help determine when you train too hard or too easy. I'm still figuring this one out as most of my results come as normal training or rested. But that is probably because I have not done a solid week of full training since the accident.
Daily use of the watch
I use the RS800CX as a regular watch for daily use and find is comfortable to wear the whole day without any issues. The design is somewhat unusual and does not resemble regular watch. Some people do not like the design, but I find it OK. Not excited about it and I prefer the design of Sunnto T6 as a daily watch, but the RS800CX is in my opinion the best HRM for multi-sport athletes and I do not need to witch between different watches. I love the back light on Polar - it is easy to activate and lights-up the watch very nicely (also during the exercise under low light conditions). The watch can be set to one of two time zones and you can quickly switch between them - useful if you travel a lot. The watch also has an alarm with snooze timer - sometimes I miss the alarm, but I guess it is more of a hard sleep on my part and me switching off the alarm while I sleep (I guess I need to put the watch on the bedside table and it will be OK). Besides alarm you can set number of reminders that I use to remind myself about doing the fitness test and own optimizer test. And lately to remind me to take the antibiotics - yeah the autumn season is upon us.
Cost
The prices quoted in this article reflect the US market prices. The prices in other markets may be quite different and I encourage you to check with the Polar dealer in your region about the actual prices of RS800CX. The watch itself can be had for 400 USD on-line. Polar also ships three different packs with pre-bundled sensors that are a better deal than buying the watch only and then adding the sensors. The RS800CX RUN with S3 stride sensor sells for 470 USD, you can buy the package RS800CX Multi with the G3 GPS sensor for the same price and if you are a cyclist you can get the RS800CX BIKE for 430 USD. The individual sensors are 135 USD for G3 GPS sensor, 140 USD for S3 stride sensor and 55 USD for bike speed sensor and the same price for bike cadence sensor. You can also pair-up your RS800CX with existing W.I.N.D. sensors you may have either with your RS800 or CS600 computers.
You may also like to review the other articles:
RS800CX - more detailed review of the functions I.
Analysis of training data (part 3 of RS800CX reviews)




 Posts

